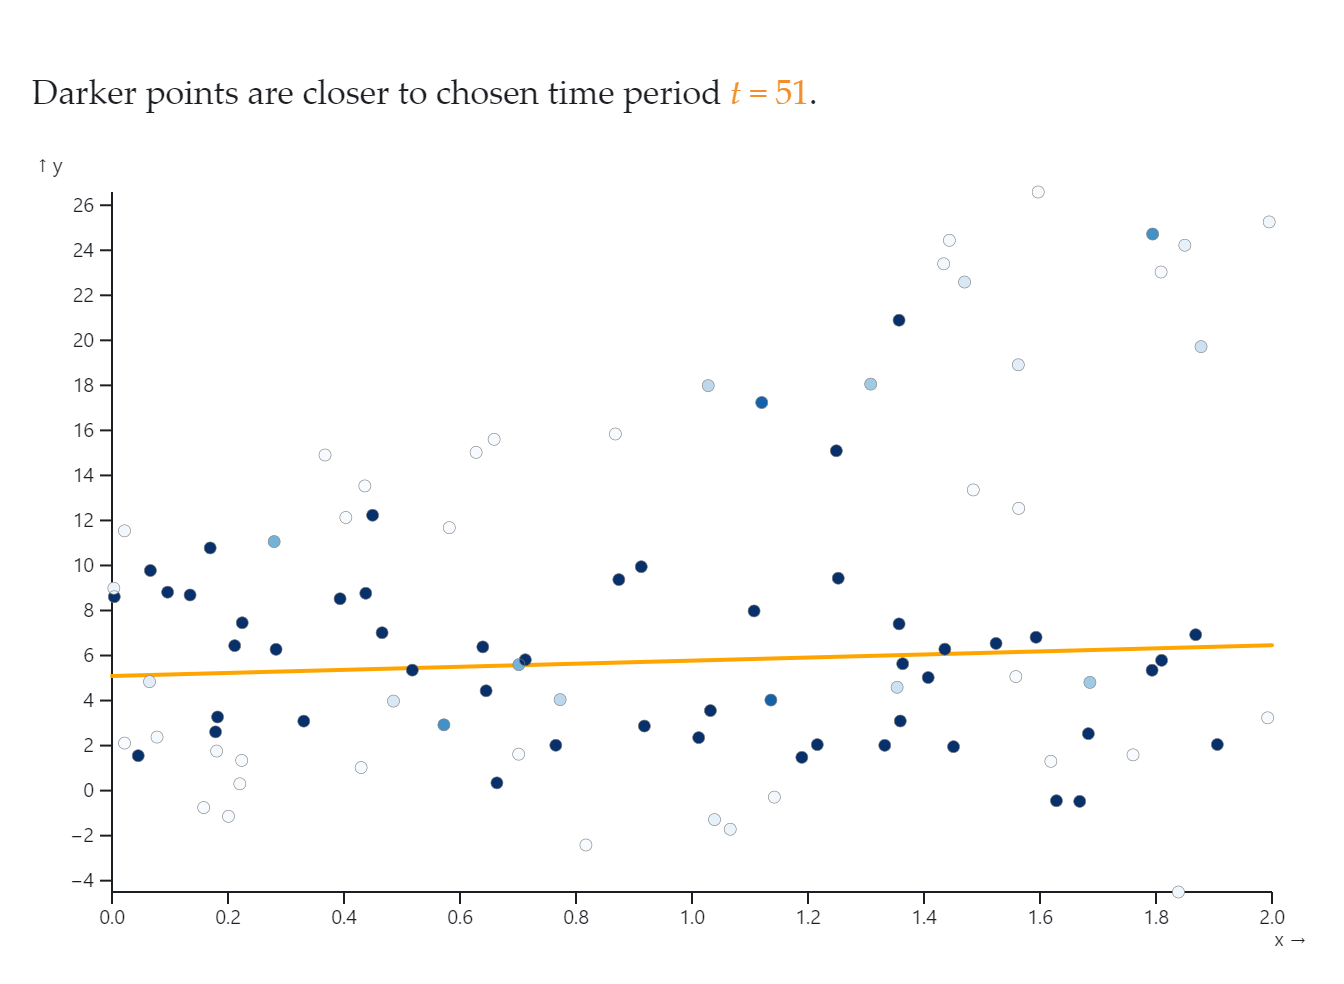
interactive Data Visualization with Observable
In this blog post of the Data Viz2024,i will explore on how to use Observable to graph interactive visulations.
Industrial development consultant & Research Assistant,
@ UNIDO & University of Trento
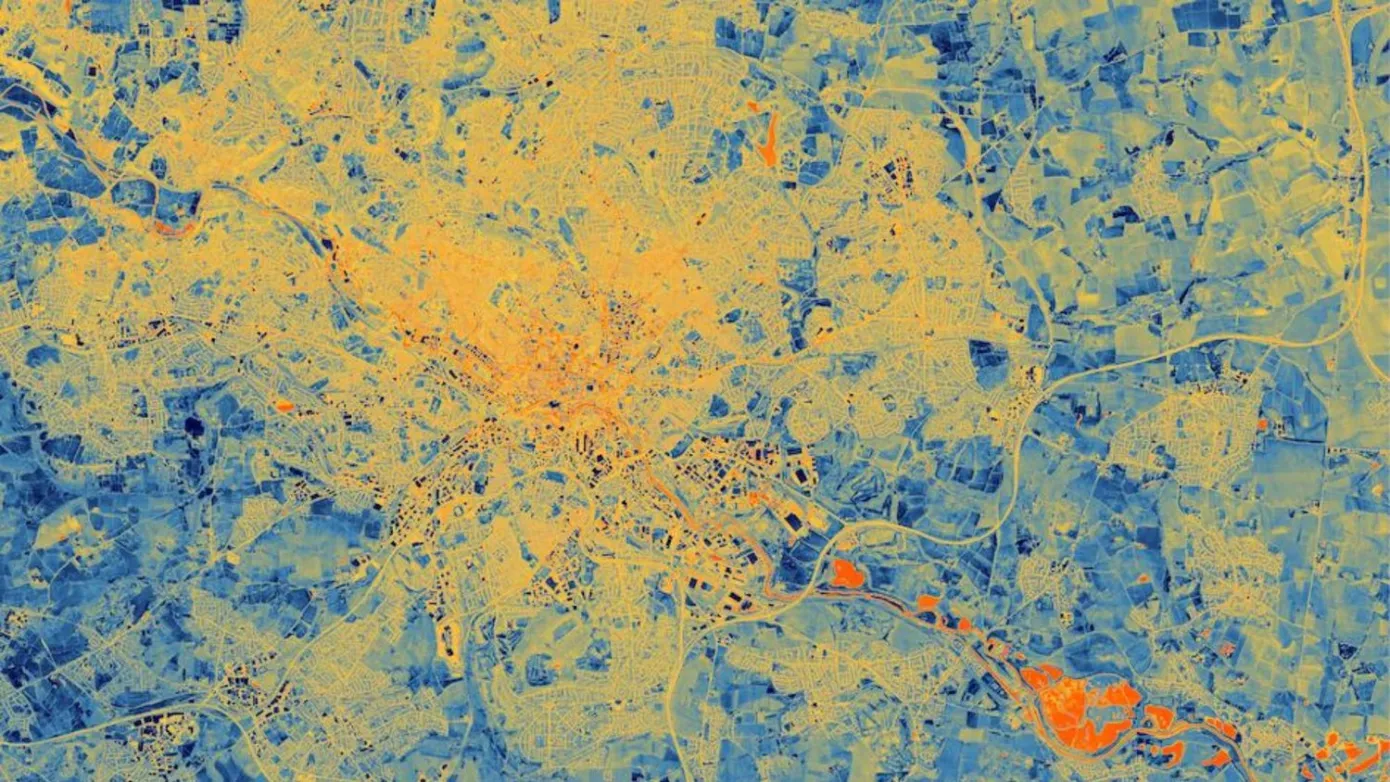
I am a Research Assistant at the University of Trento, working on slum detection in Africa and integrating earth observation data into quantitative economics to better understand the dynamics of slum evolution and inform more effective intervention policies to address informal settlements.
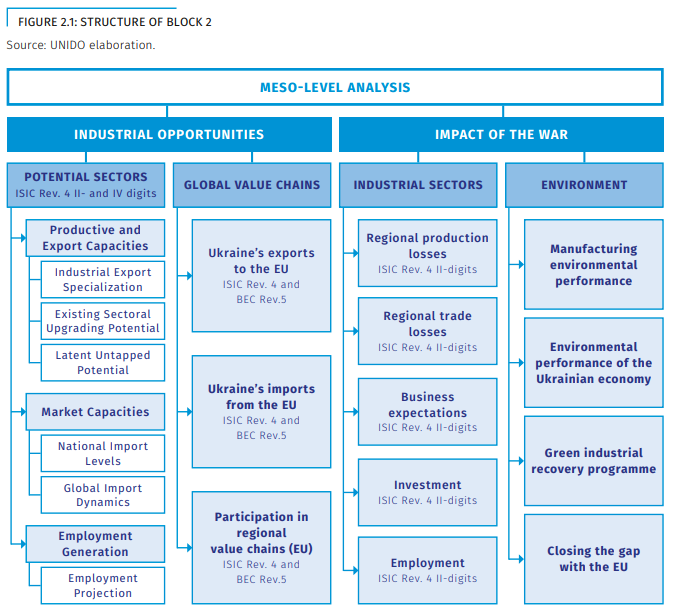
Additionally, I occasionally work as a Industrial Development Consultant at the United Nations Industrial Development Organization, focusing on industrial research, policy evaluation, and predictions using economic complexity tools.
Learn more about my research interest in publications.
Economist in the making
I am an aspiring international economist dedicated to analysing the complexities of our interconnected world. My research primarily focuses on international economics, urban economics, and earth observation studies.